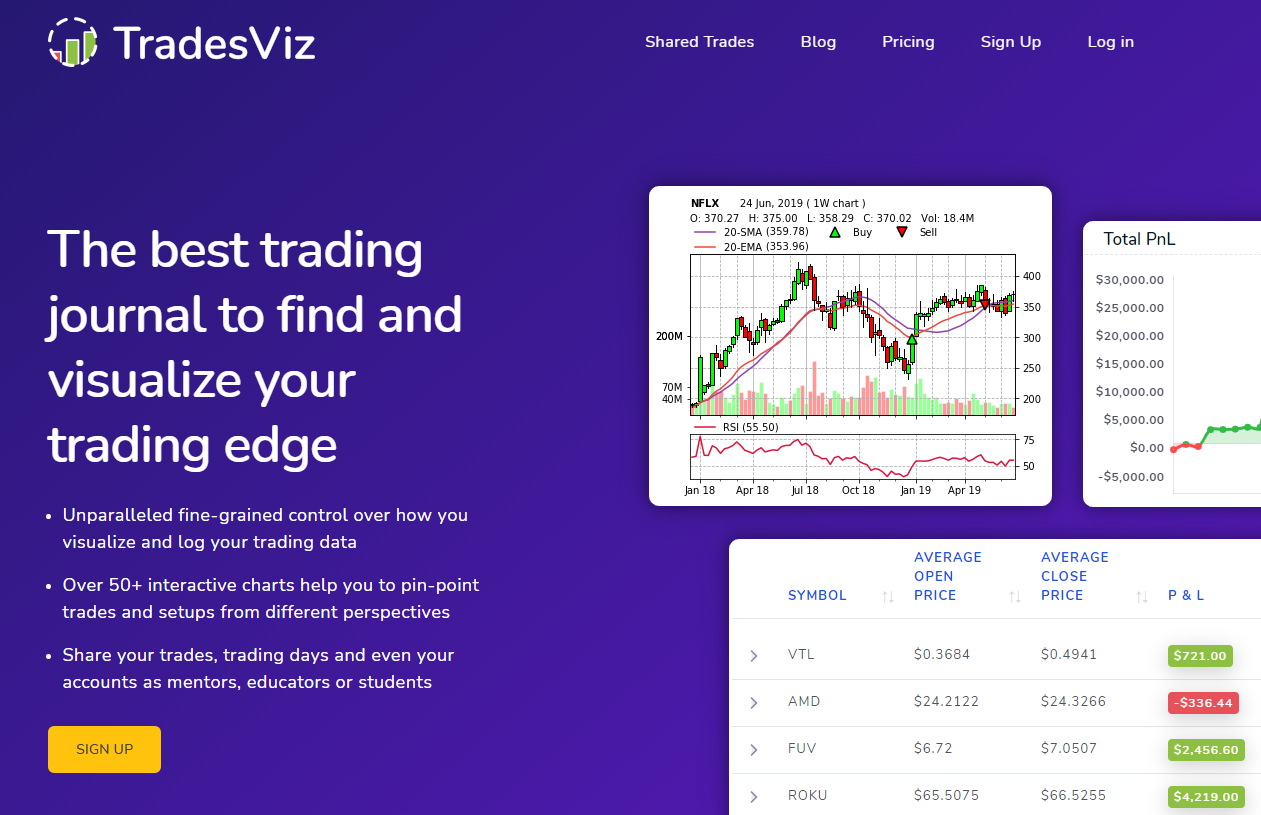
TradesViz
Data logging, analysis, interactivity, and ease of use. We combined these aspects to create an all-in-one tool for stock market traders from all over the world. TradesViz is the first and currently the only online journal to fully support US, Canada, and Indian markets.
So far, online trading journals have been very simple. You add your trades manually or import them and view a few charts. With advancements and an increase in the retail traders volume, such simple measures to gauge your performance is no longer sufficient. TradesViz is the most modern and complete solution for traders of all types internationally.
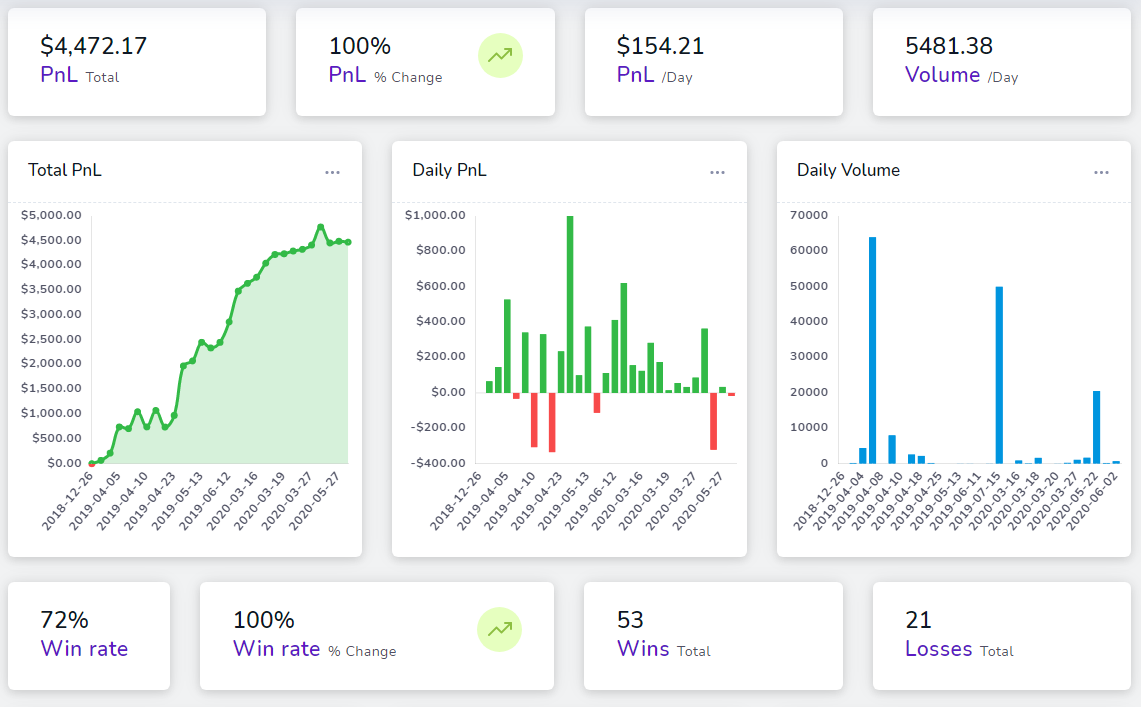
- 100+ Interactive drill-down charts
- Limitless filtering capabilities
- Fundamental analysis
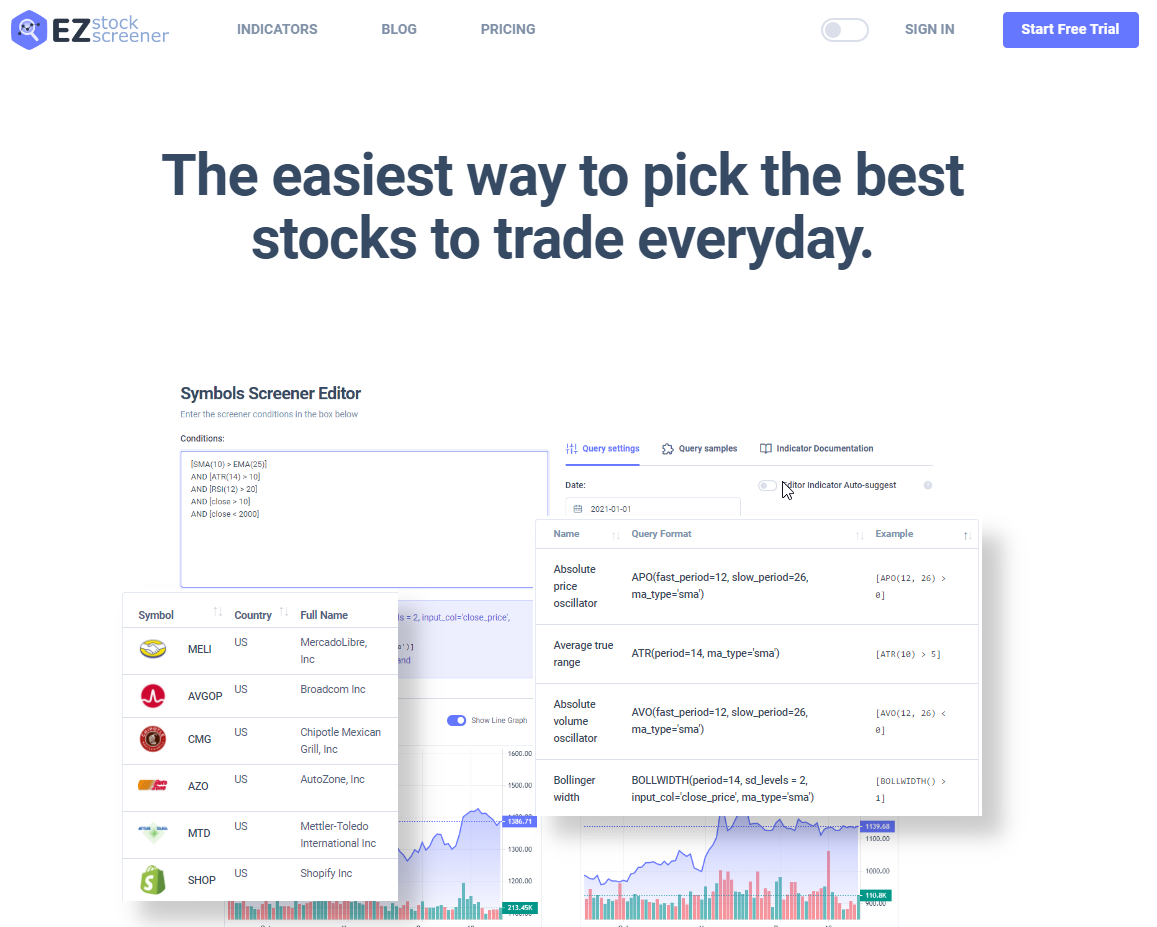
- Static/interactive stock charts with a built-in editor
- Public trade/trading day/account sharing capabilities
- and more...
Within months after launch, TradesViz reached 1000+ users from over 30 different countries and still continues to grow. TradesViz supports all popular asset types and major currencies, has instrument (stock) data for over 35,000 tickers with fully automatic daily updates, and millions of fundamental data points. We truly do the heavy lifting to provide traders a holistic solution to improve their trading performance.
Challenge
Integration of data from different sources, backend system capable of analyzing and returning 1000s of trades in mere seconds were all challenges we've had to solve.
Solution
Modular re-usable code for importing data from over 35 different brokers/platforms, efficient table schemas, and views for combining data from different sources, a custom multi-threaded pipeline for data filtering, crunching and cleaning for fast front-end performance. Custom inherited classes in the front-end charts to enable interactivity across all charts. Heavy usage of async multi-threading for the generation of statistics and stock charts to handle many users at the same time.
Result
Seamless navigation between different sections of the trading journal with no page reloads and chart rendering time within 2 secs. Importing 1000s of executions takes less than 20 secs. 100+ charts and statistics leave no room for doubt in performance analysis. The capability for fine-grained filtering gives much greater clarity when comparing several strategies at once.